Financial Ratios
20 Feb 2023Effective 1 April 2021, the Ministry of Corporate Affairs has issued certain amendments to Schedule III to the Companies Act, 2013 which prescribes certain additional requirements with regards to disclosing the following financial ratios in the financial statements of an entity
- Current Ratio,
- Debt-Equity Ratio,
- Debt Service Coverage Ratio,
- Return on Equity Ratio,
- Inventory turnover ratio,
- Trade Receivables turnover ratio,
- Trade payables turnover ratio,
- Net capital turnover ratio,
- Net profit ratio,
- Return on Capital employed,
- Return on investment.
Types of Financial Ratios
- Profitability Ratio
- Activity Ratio
- Liquidity Ratio
- Leverage Ratio
- Valuation Ratio
- Du Pont Model
Profitability Ratios
Two kinds of Profitability ratios are out there:
i. Profitability ratio based on Sales
ii. Profitability ratio based on ROI
These types of profitability ratios are very well explained in the following picture:
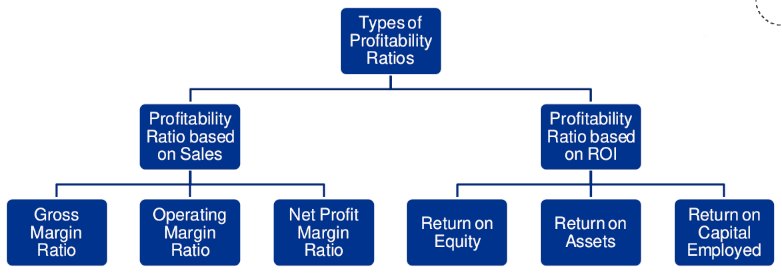
Profitability ratio based on Sales
-
Gross Margin Ratio = (Gross Profit / Net Sales)*100
Wherein:
Gross Profit = Net Sales – Cost of Goods Sold (COGS) Net sales = Total Gross Sales – Return Inwards – Discount Allowed COGS = Opening Stock - Closing Stock + purchases - purchase return + sales return
- Used to evaluate the operational performance of the business
-
Higher the ratio, better it is, since it implies that the company can cover its expenses and earn profits.
-
Operating Margin Ratio = (Operating Profit ÷ Net Sales)* 100
Wherein:
Operating Profit = Net Profit before taxes + Non-operating Expenses – Non-operating Income
OR Operating Profit = Gross Profit + Other Operating Income – Other Operating Expenses
OR
Operating Profit = Sales - COGS - Operating Expenses - Depreciation & Amortization
- The higher the ratio, the better it is, since it indicates better management of resources.
-
Net Profit Margin Ratio :
Net Profit Ratio = (Net Profit ÷ Net Sales)* 100 Wherein, Net Profit = Revenue – Cost of Goods Sold – Operating Expenses – Other Expenses – Interest – Taxes
- Tool to evaluate the overall profitability of the business.
- Higher the ratio, better it is, since it indicates that a company is more efficient at converting sales into actual profit.
Profitability ratio based on ROI
-
Return on Equity = (Net Income ÷ Average Shareholders’ Equity) * 100
wherein, Net Income = Total Income – all expenses – taxes Average Shareholders’ Equity = (Equity at the beginning + Equity at the end of the period) / 2
Note: Dividends paid to equity shareholders is not included while calculating Net Income
- Measure of the profitability of a business in relation to the equity
-
Return on Assets (ROA) = (Net Income/ Total Assets) * 100
- Indicator of how efficient a company’s management is at using its assets to generate earnings
-
Indicator of how profitable a company is relative to its assets or the resources it owns or controls.
- The higher the ROA, the better, because the company is earning more money on less investment.
-
Return on Capital Employed = (Net Operating Profit ÷ Capital Employed)* 100 wherein, Net Operating Profit = Earnings before Interest and Taxes OR Net Operating Profit = Revenue – Cost of Goods Sold – Operating Expenses Capital Employed = Total Assets – Current Liabilities
OR
Capital Employed = Equity + Long-term Debt- A higher ratio is more favourable because it means that more rupees of profits are generated by each rupee of capital employed.
Before going to the next section, here we put some of the core concepts regarding Capital Employed. These come from the Accounting Equation
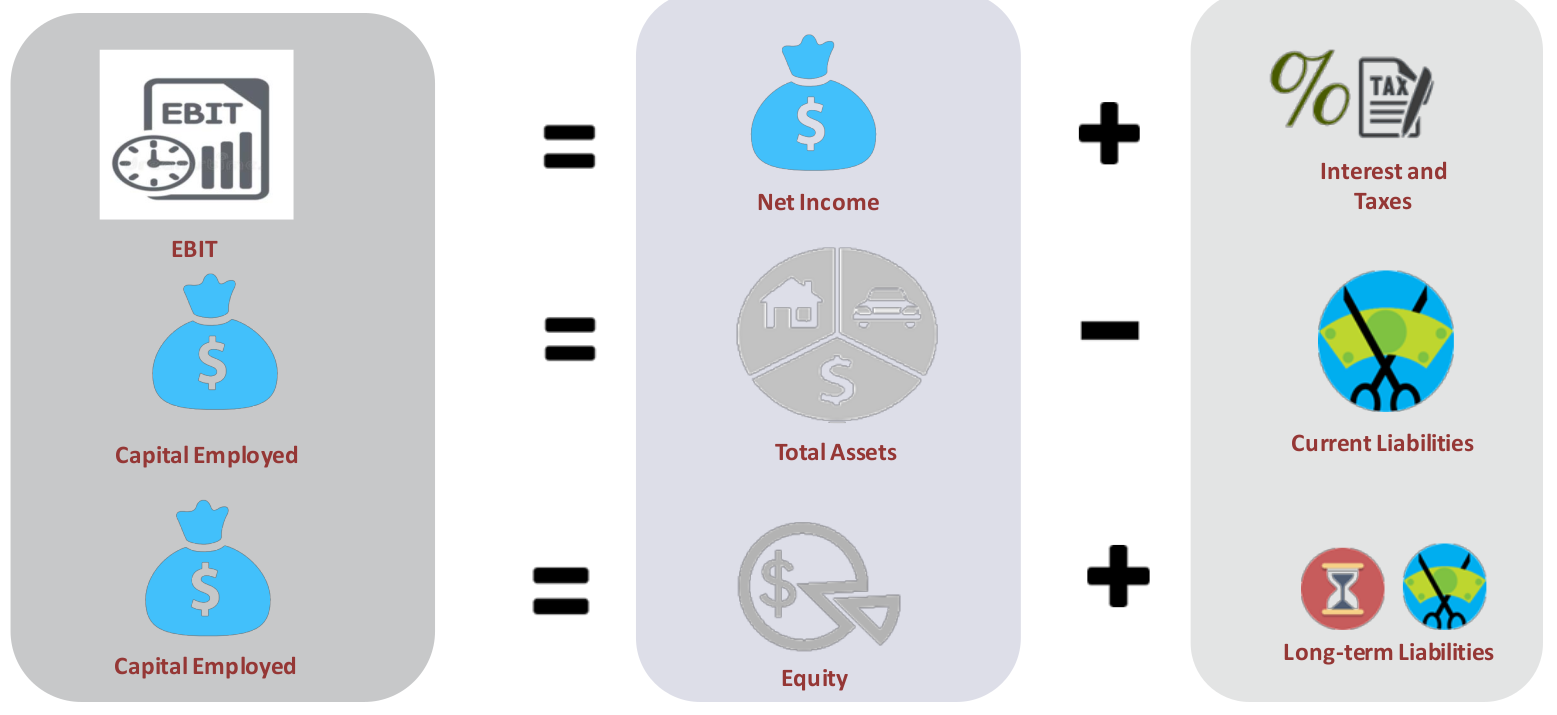
In the above, EBIT means Earnings before Income and Tax
Activity Ratios
An activity ratio is a type of financial metric that indicates how efficiently a company is leveraging the assets on its balance sheet, to generate revenue and cash. Hence this ratio is often referred to as Asset Management ratio.
Activity ratios are also referred to as Efficiency ratios or Performance ratios or Turnover ratios.
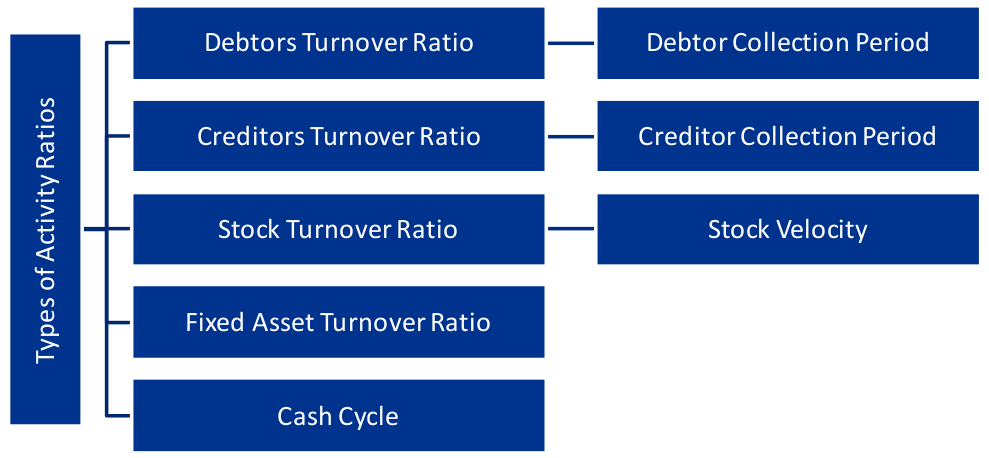
Debtors Turnover Ratio
-
Debtor’s turnover ratio = Net credit sales ÷ Average trade debtors (receivables)
-
Debtors’ collection period = (12 months / 52 weeks / 365 days) ÷ Debtor’s turnover ratio
wherein, Net credit Sales = Gross Credit Sales – Sales Returns Average trade Debtors(receivables) = (Opening Trade Debtors + Opening Trade Bills receivable + Closing Trade Debtors + Closing Trade Bills receivable) ÷ 2
Average Net Credit Sales per day = Net Credit Sales for the year ÷ No. of working days in the year.
Note: Debt Collection period can also be referred to as “Days of sales outstanding (DSO)”
High debtors turnover ratio: A high debtors turnover ratio indicates that debtors are being collected quickly and efficiently, hence, reflecting a good liquidity position.
A high turnover ratio also indicates a combination of a conservative credit policy and an aggressive collection department, as well as a number of high-quality customers.
Conversely, a very high debtor turnover ratio could also mean that entity’s debt collection procedures are too stringent, suggesting a possibility of losing sales to competitors offering more lenient credit terms.
Low debtors turnover ratio: A low turnover ratio represents an opportunity to collect excessively old accounts receivable that are unnecessarily tying up working capital.
Creditor Turnover Ratio
-
Creditors Turnover Ratio = (Net credit purchases) ÷ (Average Trade creditors + Average Trade Bills payables)
-
Average payment period = (12 months/ 52 weeks/ 365 days) ÷ Creditors Turnover Ratio
wherein, Net credit purchases = Gross credit purchases - Purchases returns Average Trade creditors + Average Trade Bills payables = (Opening Trade creditors + Opening Trade Bills payables + Closing Trade creditors + Closing Trade Bills payables) ÷ 2
Note: Average Net Credit Purchases per day = Net Credit Purchases for the year ÷ No. of working days in the year
This ratio indicates the degree of efficiency of management in paying creditors amount.
Generally, lower the ratio, the liquidity of the business concern is in better position and vice versa.
A higher creditors turnover ratio in relation to the industry suggests that the entity might not be effectively utilizing available credit facilities.
Alternatively, a very high creditor’s turnover could also mean that an entity is taking advantage of early payment discounts being offered by its suppliers.
Comparing and influencing credit period received from supplier’s vs what is offered to customers can help the firm in improving its working capital position.
Stock Turnover Ratio
-
Stock turnover ratio = Cost of goods sold ÷ Average inventory
-
Stock velocity = 12 months/ 52 weeks/ 365 days ÷ Stock turnover ratio
wherein, Cost of goods sold = Opening stock + Purchases + Direct expenses – Closing Stock OR Cost of goods sold = Sales – Gross profit
Average inventory = (Opening inventory + Closing Inventory) / 2
Note: Stock Velocity can also be referred to as “Days of Inventory on hand (DOH)”
Stock turnover ratio also implies that higher the ratio, shorter the inventory holding period.
Fixed Asset Turnover Ratio
-
Fixed Assets Turnover Ratio = Net Sales ÷ Average Fixed Assets
-
Average Fixed Assets = (Net Fixed assets beginning balance + ending balance)/ 2
Note: Average Fixed Assets
- Average of Fixed assets have to be considered and not mere closing total assets.
- Depreciation has to be reduced from Gross Block value. Hence, Net block value has to be considered and not Gross block value.
An efficiency ratio which measures how efficient a company is at generating sales from its existing fixed assets.
A higher ratio implies that management is using its fixed assets more effectively.
Cash Cycle
Cash Conversion Period = Inventory Conversion Period + Debtor Collection Period – Creditor Payment Period
Creditor Payment Period = (12 months / 52 weeks / 365 days) / (Purchases/ Average Trade payables)
The cash conversion cycle (CCC) is a metric that expresses the length of time (in days) that it takes for a company to convert its investments in inventory and other resource inputs into cash.
In other words, the cash conversion cycle calculation measures how long cash is tied up in inventory before the inventory is sold and cash is collected from customers.
Liquidity Ratios
This ratio reflects ability of the firm to pay off its short-term liabilities Also called short-term solvency ratios. Affects credibility as well as credit rating of the Company.
Current Ratio
-
Current Ratio = Current assets ÷ Current liabilities
This ratio measures company’s ability to meet its current obligations out of its current assets.
-
Ideal current ratio = 2:1 (This means that the Company has more than enough cash to meet its liabilities while using its capital effectively). The difference between the current assets and current liabilities is known as “working capital”.
-
Working capital = Current assets – Current liabilities
Liquid Ratio / Quick Ratio / Acid Test Ratio
-
Liquid Ratio = Liquid assets ÷ Current liabilities wherein,
Liquid assets = Current assets – (stock + prepaid expenses)
Stock and prepaid assets are not included in the calculation of liquid assets
-
Ideal quick ratio = 1:1 (This means that the Company has sufficient liquid assets so that current obligations can be met).
This ratio measures whether a business can meet its current obligations with only selling off their quick assets.
Cash Ratio
Cash Ratio: (Cash + Marketable securities) ÷ Current Liabilities
Indicates whether the company has enough cash balance to cover the current liabilities.
Indicator of a firm’s value where the company is about to shut down.
Working Capital Turnover Ratio
Working Capital Turnover Ratio is calculated to determine how efficiently the company is using its working capital in the business.
Working Capital Turnover Ratio = Net Annual Sales ÷ Average Working Capital wherein, Working Capital = Current Assets – Current Liabilities
High Ratio: Indicator of efficient management in using company’s short-term assets and liabilities for supporting sales
Low Ratio: It indicates that a business is investing more in accounts receivable and inventory to support its sales, which could lead to an excessive amount of bad debts or obsolete inventory.
Leverage Ratio
Leverage ratio refers to a set of ratios that look at how much capital comes in the form of debt (loans) or assesses the ability of a company to meet its financial obligations.
These ratios are also called long-term solvency ratios.
Evaluates company solvency and capital structure
Assures lenders of periodic payments of interest and repayment of principal amounts on maturity
There are two types of leverage ratios: i. Capital Structure Ratios ii. Coverage Ratios
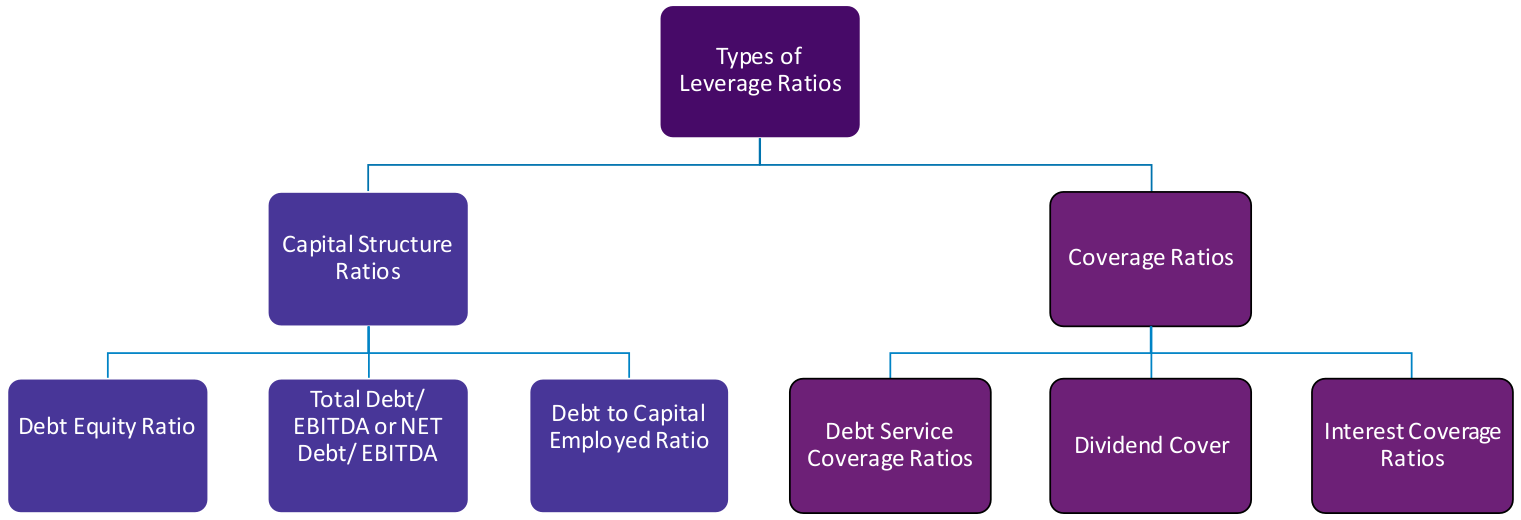
Capital Structure Ratio
Capital structure ratios are based on the proportions of debt and equity in the capital structure of the entity.
-
Debt Equity Ratio = Total Debt ÷ Equity
Wherein,
- Total Debt, includes short and long-term borrowings from financial institutions, debentures/bonds, deferred payment arrangements for buying capital equipment, bank borrowings, public deposits and any other interest bearing loan.
- Interest-bearing debt includes bonds payable, bank loans, notes payable, etc.
- Non-interest-bearing debt includes trade payable, accrued expenses, etc.
- Equity is equity share capital and reserves and surplus (excluding fictitious assets etc.)
High Debt Equity ratio means high risk for for a single value of rupee
-
Total Debt to EBITDA Ratio = Total Debt or Net Debt / EBITDA
Net Debt = Total Debt – Cash and cash equivalent Cash and cash equivalent = Cash in hand, demand deposits and short-term highly liquid investments readily realisable within 3 months EBITDA – Earnings before interest, tax, depreciation and amortization
- The debt/EBITDA ratio compares a company’s total debt obligations, including debt and other liabilities, to the actual cash being generated by the company
- High Debt/EBITDA means high debt for a single value of rupee
| Earnings before Interest and Taxes (EBIT) | Earnings before Interest, Taxes , Depreciation and Amortization (EBITDA) |
|---|---|
| EBIT = Total Revenue – Cost of Goods Sold – Operating Expenses | EBITDA = EBIT + Depreciation + Amortization |
| Helps to identify a company’s ability to generate enough earnings to be profitable, pay down debt and fund ongoing operations. | Way to evaluate a company’s performance without having to factor in financing and accounting decisions. |
-
Debt to Capital Employed Ratio = Total Debt ÷ Capital Employed
Capital Employed = Total Assets – Current Liabilities OR Capital Employed = Equity + Long-term Debt
- Measures how much of the firm’s asset base is financed using debt.
Coverage Ratios
A coverage ratio, broadly, is a metric intended to measure a company’s ability to service its debt and meet its financial obligations, such as interest payments or dividends.
-
Debt Service Coverage Ratio = (Net Profit + Depreciation & Amortization + Interest) ÷ (Interest Expense + Principal Repayment obligation)
-
This ratio should be greater than 1 to service expenses effectively
-
The debt service coverage ratio is a financial ratio that measures a company’s ability to service its current debts by comparing its net operating income with its total debt service obligations.
-
-
Dividend Cover Ratio = (Net Income – Preferred dividends) / Dividends paid to ordinary shareholders
-
This ratio measures the number of times that a company can pay dividends to its shareholders.
-
Investors use dividend cover ratio to gauge the level of risk associated with the receipt of dividends on their investment.
-
Higher the ratio , higher is the dividend payouts in future.
-
-
Interest Coverage Ratio = EBIT / Total Interest Expense
- This ratio measures the ability of a company to pay the interest on its outstanding debt.
- High interest coverage ratio means low risk
Valuation Ratio
A valuation ratio shows the relationship between the market value of a company or its equity and some fundamental financial metric (e.g., earnings). The point of a valuation ratio is to show the price one is paying for some stream of earnings, revenue, or cash flow (or other financial metric).
Price to Book Ratio (P/B)
-
Price to Book Ratio = Price per Share / Book Value per Share
-
Price to Book Ratio = Market Cap / Net Worth
-
Book Value = Total Assets – (Intangible Assets + Liabilities)
OR, Value at which the asset is carried on a balance sheet by taking the cost of an asset minus the accumulated depreciation.
Lower P/B ratio means stock undervalue
One of the major limitation is that it does not consider intangible assets like Goodwill which leads to low book value and high artificial price/book ratio.
Earnings Per Share (EPS)
- Earnings per Share = (Net Income – Preferred Dividends) ÷ (Weighted Average Common Shares Outstanding)
- It is an indicator of a Company’s profitability.
- Higher EPS indicates that a company is more profitable and has more profits to distribute to its shareholders.
- Higher EPS means higher stock price
EV / EBITDA Ratio
- EV/EBITDA = Enterprise Value / EBITDA
- Enterprise Value (EV) = (Market Cap + Net Debt + Minority Interest + Preferred Shares) – Cash & Cash Equivalents
- EBITDA is the earnings available to the stakeholders or Capital Provider (Debts + Equity)
- Reflects the market value of claims that equity holders, preferred holders and debt holders have on the company.
- Higher EV/EBITDA higher earnings available to the stakeholders
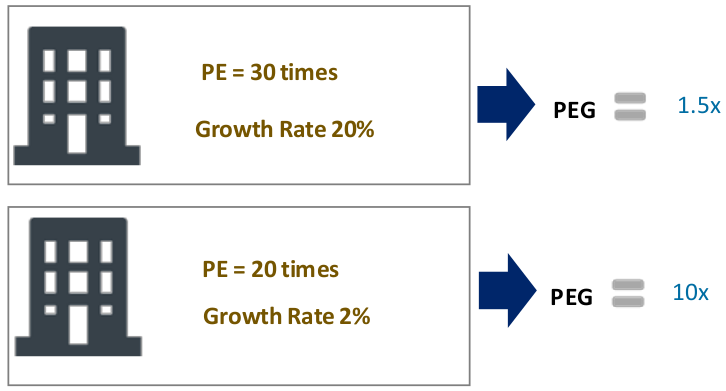
Price/Earnings to Growth Ratio
- Price/Earnings to Growth Ratio (PEG) = PE Ratio / Expected Growth (G)
-
Where G is the Projected Annual Growth in Earnings per Share
- PEG helps us in comparing PE with growth.
- PEG ratio is PE ratio / expected growth
- Higher PE ratio, higher expected earnings
- The PEG ratio uses the basic format of the P/E ratio for a numerator and then divides by the potential growth for EPS, which one have to estimate.
- The two ratios may seem to be very similar, but the PEG ratio is able to take into account future earnings growth.
- A rule of thumb is that any PEG ratio below 1.0 is considered to be a good value.
What is Du-Pont Analysis?
The Du-Pont analysis or the Return On Equity ratio essentially measures the rate of return that the owners of common stock of a company receive on their shareholdings. Return on equity signifies how good the company is in generating returns on the investment it received from its shareholders.
ROE = Net Income / Shareholders Equity
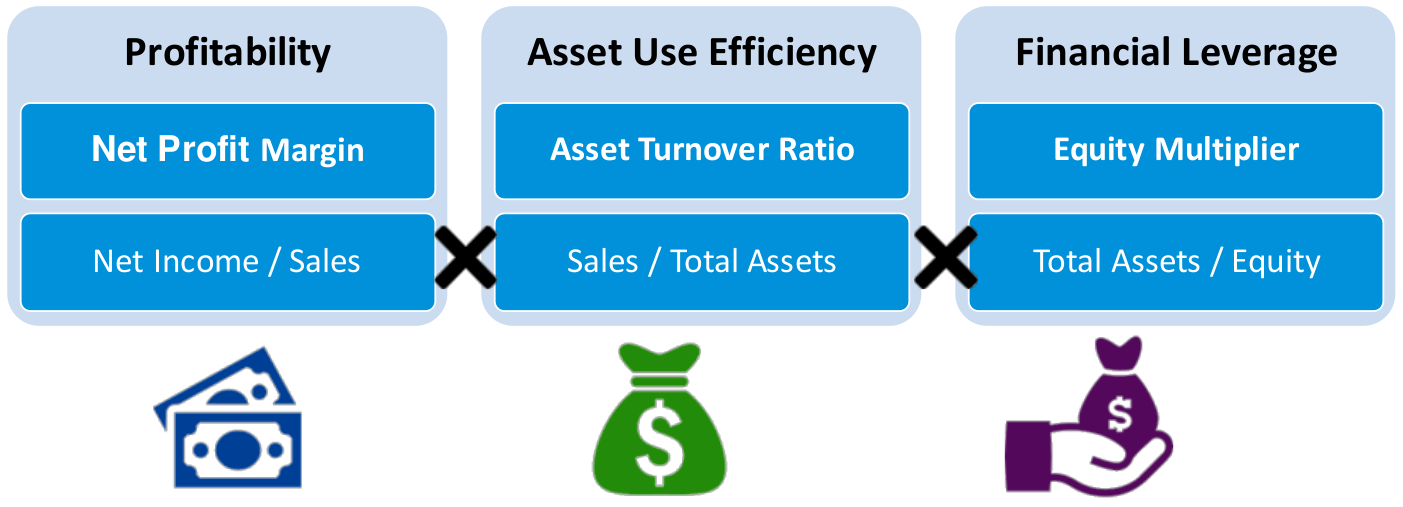
Net Profit Margin
It measures the amount of profit that a business can extract from its total sales.
- Net Profit = (Revenue – Variable Expenses – Fixed Expenses – Interest Costs – Tax)
- Net Profit Margin = (Net Profit / Sales)*100
- As NPM increases, ROE (Return on Equity) increases
Components Dependent on sales and cost effectiveness
Assets Turnover Ratio
- Total Assets Turnover Ratio = Net Sales ÷ Average Total Assets
- Average Total Assets = (Net assets beginning balance + ending balance)/ 2
- This ratio is an indicator of the efficiency with which a company is using its assets to generate revenue.
- The higher the asset turnover ratio, the more efficient a company is.
Financial Leverage
The equity multiplier is a risk indicator that measures the portion of a company’s assets that is financed by stockholder’s equity rather than by debt.
- Financial Leverage Ratio = Assets ÷ Equity
Proprietary Ratio
- Proprietary Ratio = {(Shareholders’ Funds) ÷ (Total Assets)} * 100 wherein, Shareholders’ Funds = Share Capital + Reserves and Surplus Also referred to as Net Worth Ratio or Equity Ratio. Indicates the proportion of total assets of a company which are financed by proprietors’ funds. Helps to determine the financial strength of a company.
EBITDA to Total assets
- EBITDA to Total assets = EBITDA ÷ Total Assets
- EBITDA = Net Profit + Interest + Tax + Depreciation & Amortization
- Higher the ratio, the more effective the company is, in using its assets M\measures the amount of EBITDA profit generated in comparison to Total Assets.
Retained Earnings to Total assets
-
Retained Earnings to Total assets = Retained Earnings ÷ Total Assets
-
Measures the company’s ability to accumulate earnings using its Total Assets.
-
Measures the extent to which a company relies on debt, or leverage.
-
Lower the ratio, the more a company is funding assets by borrowing instead of through retained earnings.
-
Increases the risk of bankruptcy if the firm cannot meet its debt obligations.
Market Capitalization to Total Liabilities
- Market Capitalization: Total market value of all the outstanding shares Share Price * Amount of shares outstanding
- Total Liabilities: Referred to as Total Debt(Long-term debt + Short-term debt) (Market value of Stock ÷ Total Debt)
Dividend Payout Ratio (DPS)
- DPS = Dividend per share (Dividend yield * Market price per share) EPS = Earnings per share